

Introduction: Making Sense of the Data Deluge
Every day, the world creates more information than you can imagine. Emails, clicks, videos, sensors, and transactions flood into systems from every direction. By 2026, the global data analytics market has already reached well over $400 billion, according to recent reports on the big data analytics market size. That number is expected to keep climbing fast.
But here is the thing. Raw data by itself is just noise. A pile of numbers and text means nothing until you turn it into something useful.

That is where data analytics comes in. It is the process of cleaning, shaping, and studying information to find patterns and answers. Data analysts use methods like data pipelines to move information from place to place and data scraping to pull in outside sources. But the real magic happens when you ask the right questions and let the numbers tell a story.
For AI professionals and business leaders, understanding what is data analytics is not just nice to know. It is a must have skill in 2026. The companies that get it right make faster decisions, spot trends early, and serve their customers better. The ones that ignore it get left behind.
This guide will give you a clear breakdown of how data analytics works, how to use it in real projects, and how to avoid common traps. Along the way, we will look at the ai data analytics 2026 trends that are driving real results this year. You do not need to be a math genius or a coder. You just need curiosity and a willingness to learn.
If you want to stay ahead of the fast moving AI world, consider subscribing to The AI Newsletter Worth Reading for clear daily updates.
1. Defining Data Analytics: Beyond the Buzzword
You hear the term everywhere these days. But when someone asks you what data analytics actually means, do you have a crisp answer ready?
Here is a solid definition. Data analytics is the systematic computational analysis of data. You collect raw information, clean it, study it, and uncover patterns that help you make smarter decisions. The data analytics definition according to IBM explains that data analytics is a task under the data science umbrella focused on querying, interpreting, and visualizing datasets to answer specific questions.
That sounds straightforward. But many people mix data analytics up with two related fields: business intelligence and data science.
Business intelligence is mainly about looking backward. It tells you what happened last quarter or how many customers you had last month. Data analytics goes further. It asks why something happened and what will likely happen next. It is more forward looking.
Data science is even broader. It includes building machine learning models, running experiments, and creating entirely new algorithms. Data science is about discovery and prediction at scale. Data analytics is the practical application of those methods to solve everyday business problems.
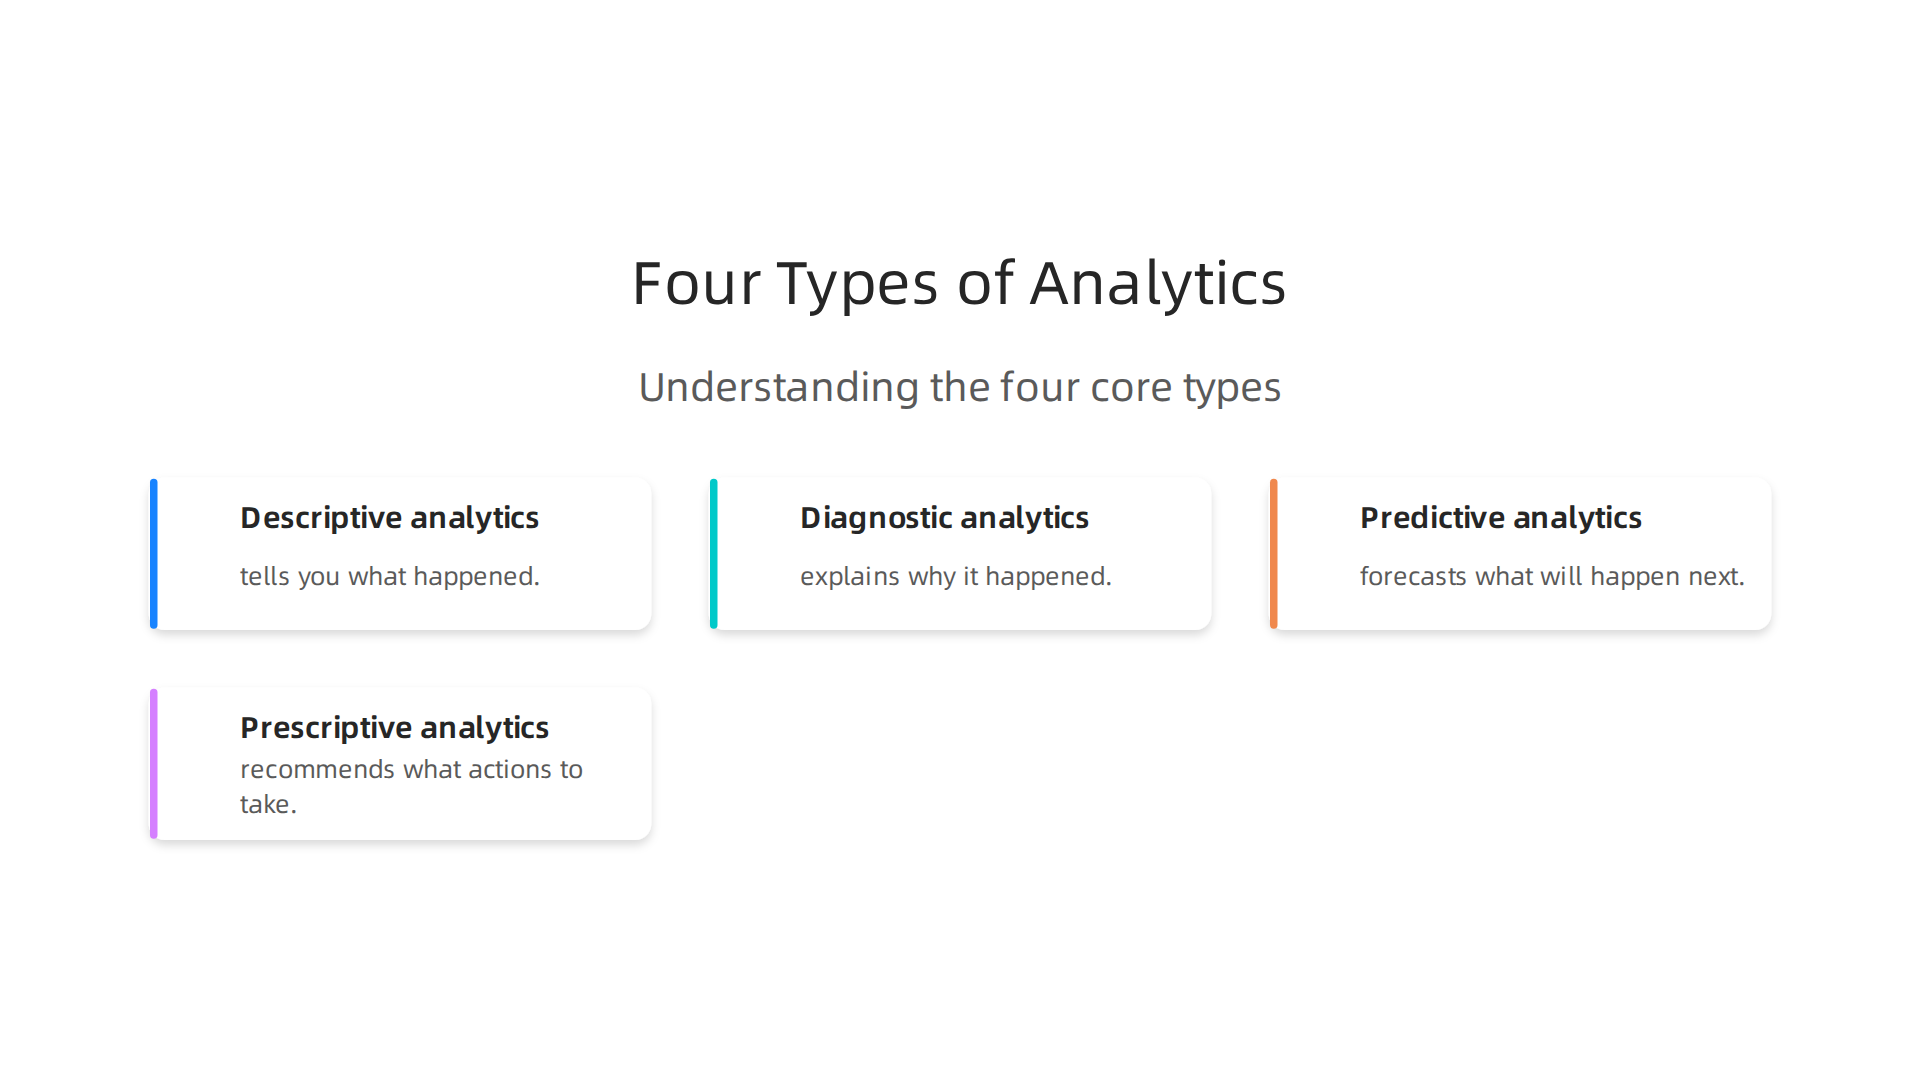
Within data analytics, there are four main types you should know:
- Descriptive analytics tells you what happened.
- Diagnostic analytics explains why it happened.
- Predictive analytics forecasts what will happen next.
- Prescriptive analytics recommends what actions to take.
These four levels build on each other. Most teams start with descriptive analytics to understand their past and then move toward predictive and prescriptive analytics to get ahead.
Getting the definition right matters because it helps everyone on your team stay aligned.

When a stakeholder asks for analytics, you can clarify what kind they really need: a historical report, a diagnosis of a problem, or a prediction of future trends.
If you are ready to go deeper, check out our guide on the top data analytics certifications for AI careers. It will help you choose the right training path in 2026.
2. The Core Types of Data Analytics You Need to Know
Now that you understand the definition, it’s time to dig into the four types of data analytics that actually move the needle for businesses. Each type answers a different question and serves a unique purpose. Knowing the difference helps you figure out where to spend your time and money.
Descriptive analytics answers the simplest question: “What happened?” It looks at past data and summarizes it. Think of a dashboard that shows last month’s sales numbers or website traffic. Most companies start here because it is easy to set up and gives a clear picture of performance. The best part? You don’t need fancy tools. A spreadsheet can do the job.
Diagnostic analytics goes one level deeper. It asks “Why did it happen?” When sales drop in March, diagnostic analytics helps you find the cause. Maybe a competitor launched a new product. Or your marketing campaign underperformed. This type uses techniques like correlation analysis and drill-downs to uncover root causes. It turns a simple report into a real investigation.
Predictive analytics uses historical data to forecast what will happen next. It spots patterns and trends to make educated guesses about the future. For example, a retailer might predict which products will sell out during the holiday season. Or a hospital might forecast which regions will see a rise in flu cases. This is where the real power of data comes alive. The team at GeeksforGeeks lists types of data analytics including predictive as one of the most impactful for forward looking decisions.
Prescriptive analytics goes even further. It not only predicts what will happen but also recommends actions. Think of it as your data driven advisor. For instance, a shipping company can use prescriptive analytics to choose the best delivery routes to save fuel and time. This type combines AI and big data to suggest the best move in any situation.
Most organizations move through these stages step by step. They start with descriptive, then add diagnostic, then predictive, and finally prescriptive. But you do not have to follow that order exactly. The key is to match the type of analytics to the question you are trying to answer.
Understanding these four types helps you prioritize your data projects. If your team is spending all its time on descriptive reports, you might be missing the chance to predict and prevent problems. A good mix of all four gives you a complete picture of your business.
As you build your analytics skills, keep an eye on the latest trends. The field changes fast, and staying informed matters. If you want to keep up with what is new in AI and data, The AI Newsletter Worth Reading delivers clear daily updates straight to your inbox. It will help you connect what you learn here to real world breakthroughs.
For more hands on guidance on applying these types in your work, check out this practical overview of AI data analytics 2026 trends that deliver real results. It shows you how companies are using these same four types to drive growth today.
3. The Modern Data Analytics Workflow: From Raw Data to Insight
Knowing the four types of analytics is only half the battle. You also need a clear process to turn raw data into real insights. That process is called the data analytics workflow. It maps out every step from the moment data enters your system to the moment you make a decision based on it.
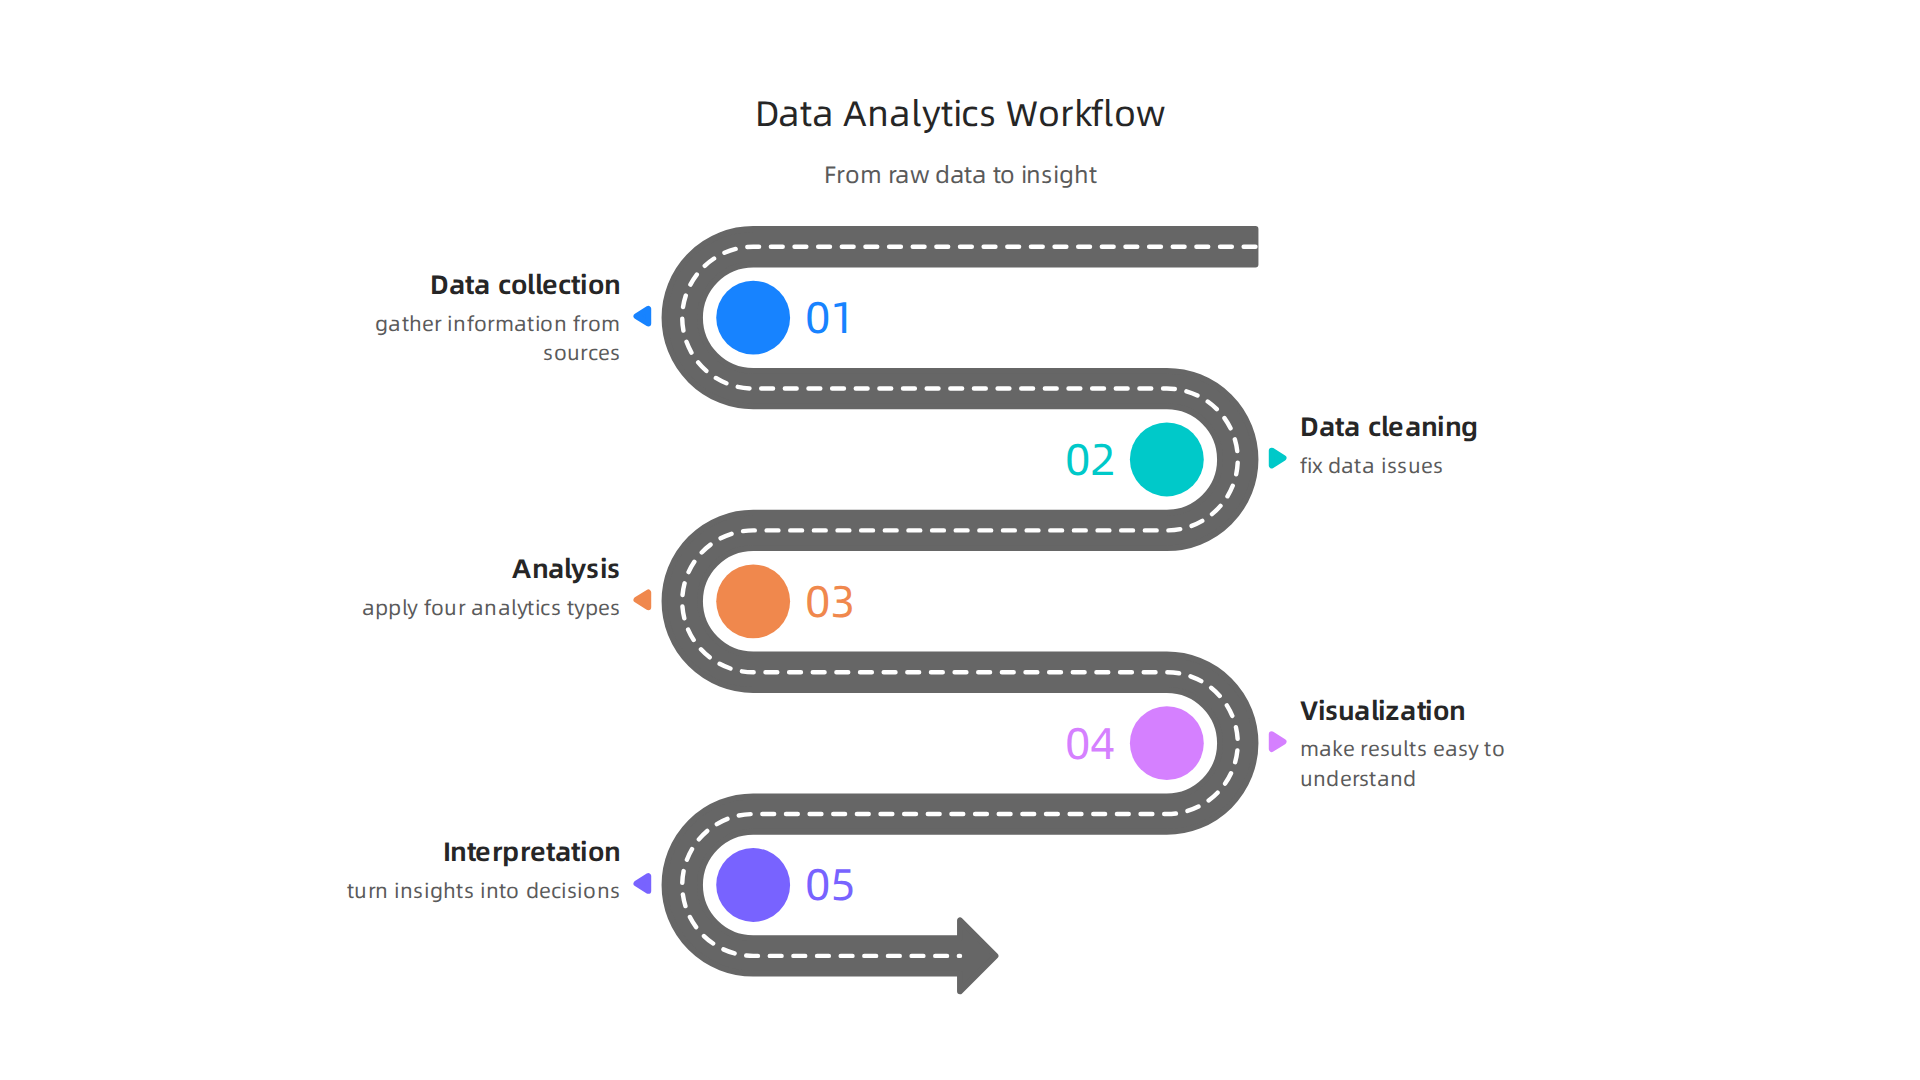
The Five Key Steps
-
Data collection
This is where you gather information from different sources. It could be website traffic logs, customer surveys, sensor readings, or sales records. Many teams use automated data scraping tools or APIs to pull in data without manual effort. -
Data cleaning and transformation
Raw data is almost always messy. You will find duplicates, missing values, and inconsistent formats. Cleaning fixes those issues. Transformation changes the data into a structure that analysis tools can understand. This step often involves building a data pipeline that moves and reshapes data automatically. -
Analysis
Now you apply the four types of analytics we covered earlier. You summarize what happened, figure out why, predict what might happen next, and even get recommendations. This is where the real value comes to life. -
Visualization
Charts, graphs, and dashboards make the results easy to understand at a glance. A good visualization tells a story without needing a long explanation. -
Interpretation and action
The final step is turning insights into decisions. You explain what the data means to your team and decide what to do next. Without this step, all the previous work has no impact.
How Modern Workflows Speed Things Up
In 2026, most companies no longer follow this workflow manually. Modern architectures use cloud data lakes and automated pipelines to handle the heavy lifting. For example, a modern data stack often uses ELT (extract, load, transform) instead of the older ETL approach, which saves time and allows for faster iteration. The team at AtScale explains that automation in modern data architecture focuses on removing repetitive tasks like schema detection and data validation so your people can focus on analysis instead.
Many organizations also use AI-powered tools to clean data, detect anomalies, and even suggest visualizations. These tools reduce errors and cut the time from raw data to insight from weeks to minutes.
Understanding this workflow helps you spot bottlenecks in your own process.

Maybe your team spends too long cleaning data. Or maybe you jump straight to analysis without proper collection. Identifying these weak points lets you fix them and get better results faster.
If you want to build the skills needed for each step, our complete guide on how to succeed as a data analyst in 2026 walks you through the tools and techniques that top teams use today. It is a great next resource after learning the workflow.
Now that you have a solid grasp of both the types of analytics and the workflow, you are ready to start applying them. The next section will show you how to pick the right tools for each stage.
4. Key Tools and Technologies Driving Data Analytics in 2026
You now understand the analytics workflow. The next step is picking the tools that bring that workflow to life.
The right tool lets you move faster, catch more insights, and avoid getting stuck on the wrong tasks.
The Core Tools That Still Matter
Some tools have been around for years and are not going anywhere.
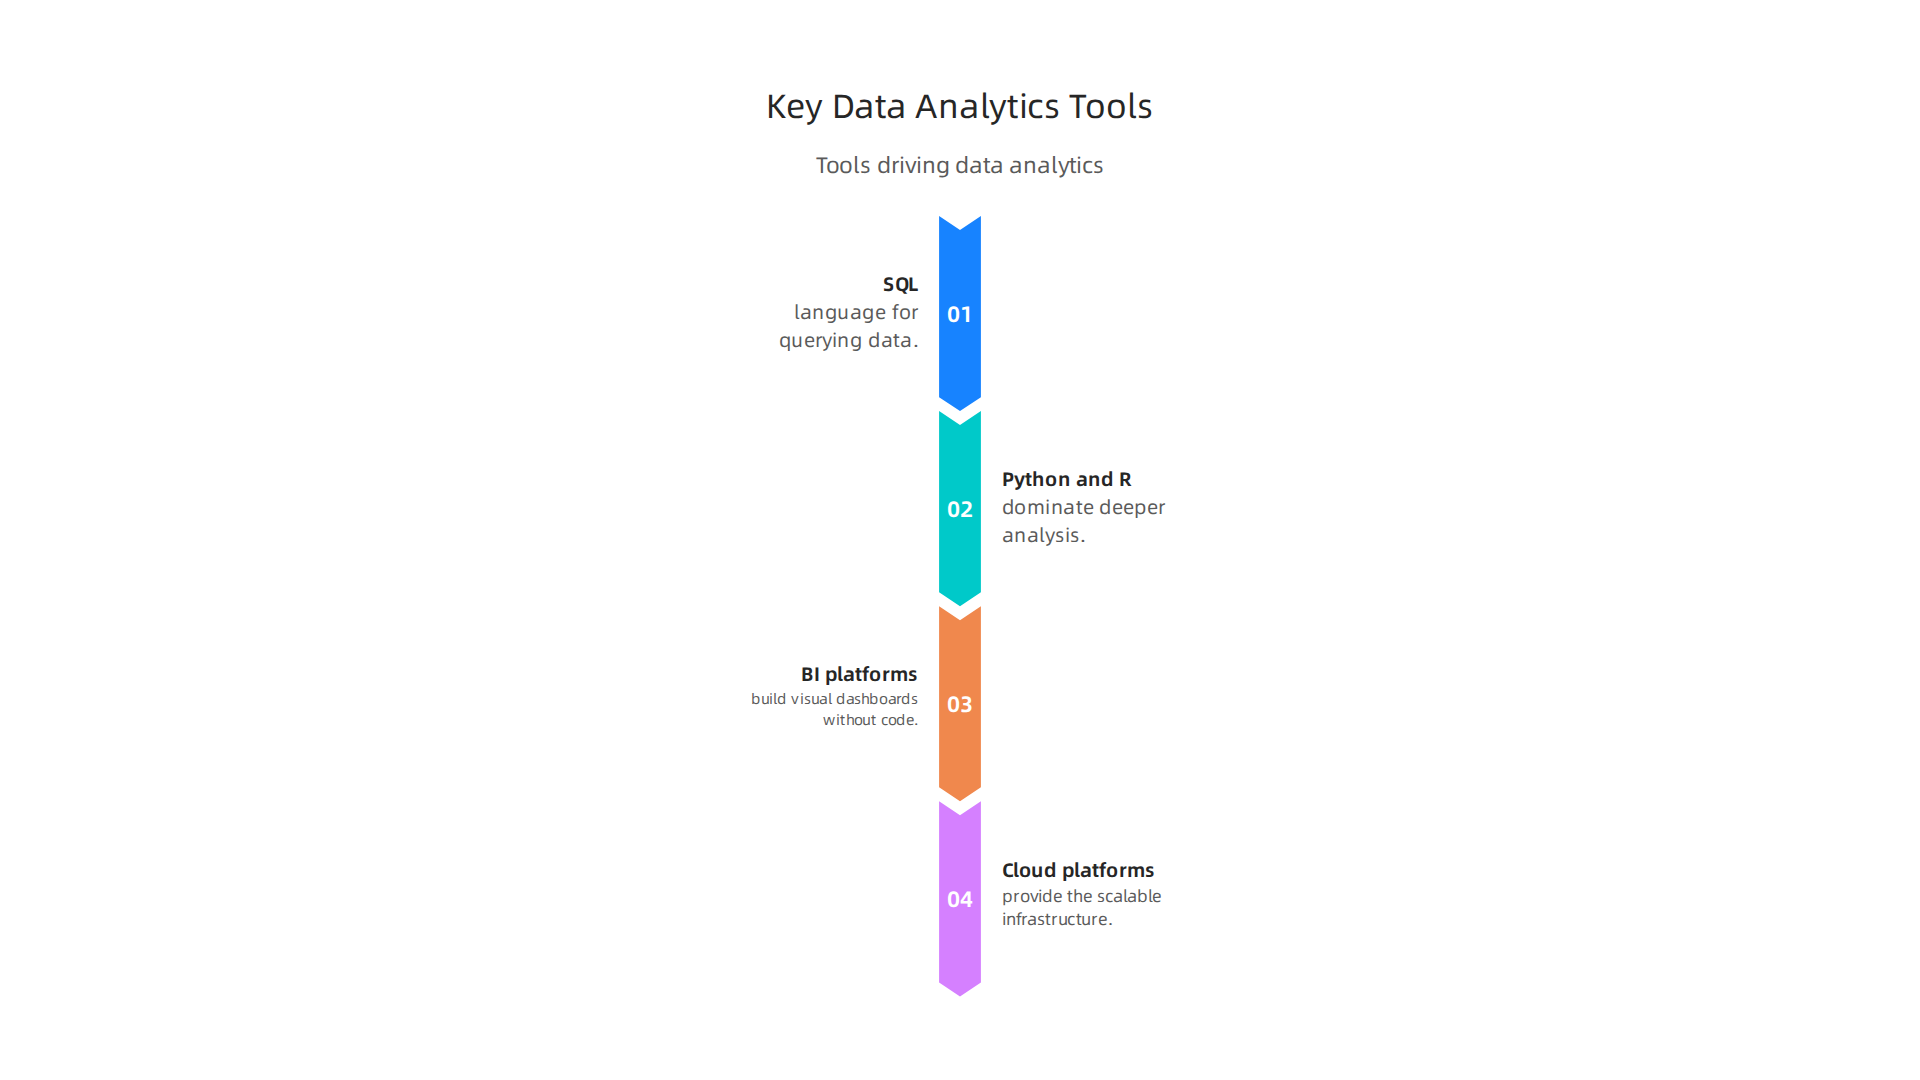
SQL is the language for querying data. If you are working with structured data stored in a database, SQL is how you ask questions. It is hands down the most transferable skill across every analytics role.
Python and R dominate deeper analysis. Python, especially with libraries like pandas, handles everything from cleaning data to running advanced models. R is still the go-to for statistical work and academic research. The AtScale team ranks Python and pandas as a top tool for analysts and engineers in 2026, and for good reason: you can automate nearly any data task with a few lines of code.
BI platforms like Tableau and Microsoft Power BI let you build visual dashboards without writing code. They connect to databases and cloud warehouses, refresh automatically, and give business users instant access to what is happening.
Cloud platforms (AWS, Azure, Google Cloud) provide the scalable infrastructure that modern analytics runs on. You store data in cloud data lakes, run queries in serverless warehouses like Snowflake or BigQuery, and orchestrate pipelines using services like Azure Data Factory. This eliminates the need to manage physical servers.
The New Wave: AI Native Analytics Tools
2026 is the year AI powered tools started changing how people work with data. Platforms like Hex mix SQL, Python, and AI cells in one workspace. Databricks Genie answers natural language questions with charts and code. Claude can read your raw data and iterate with you on the analysis.
These tools lower the barrier to entry. You do not need to be a top code expert to get started. But you do need to evaluate them carefully. Not every AI tool delivers reliable results. As one comparison of top data analytics platforms in 2026 explains, there is no universal best solution. The right choice always depends on your specific use case, team skills, and budget.
How to Choose
Start with the problem you are solving. SQL works for direct queries. Python is best when you need flexibility. BI tools are ideal when you need to share results widely. Cloud platforms solve scalability. AI tools shine when you want to speed up exploration.
If you want to see how these trends are playing out across industries, check out our roundup of AI data analytics trends for 2026. It covers real examples of teams using these tools today.
The analytics landscape changes fast. To stay current on new tools and breakthroughs, get clear daily AI updates from The Deep View Newsletter. It is a quick, reliable way to keep your finger on the pulse without getting overwhelmed.
5. How to Build a Data Analytics Strategy That Drives Impact
Having the right tools is only half the picture. Without a clear strategy, your data pipeline can produce charts that nobody acts on.

You end up with busy work, not business value. Here is how to build a data analytics strategy that actually moves the needle.
Step One: Align with Real Business Goals
Before you run a single query, ask yourself: what does the business actually need right now? Look at the company’s top priorities. Is it cutting costs? Growing revenue? Retaining customers? Every analysis should connect to one of these.
This is a core principle in modern data architecture. As one expert breakdown of modern data architecture principles explains, customer-centric design makes sure that every technical investment serves a real outcome. If your work does not tie to a business goal, it will not get funding or attention.
Start by defining clear KPIs with your stakeholders. For example, if the goal is customer retention, your analytics might track churn rates, repeat purchase behavior, and support ticket trends. That is far more useful than a generic dashboard of every possible metric.
Step Two: Build a Data-Driven Culture
Tools do not change a company. People do. The best strategy in the world fails if your team does not trust or understand the numbers.
Focus on two things: access and upskilling. Give non-technical teams simple dashboards and teach them how to read them. When a marketing manager can open a report and see which campaigns work best, they make better decisions without waiting for you.
This kind of collaboration is a key feature of modern data architecture principles as outlined by IBM. When data flows freely and people know how to use it, the whole organization gets smarter.
Do not forget to celebrate small wins. If someone in sales uses a dashboard to spot a trend and close a deal, talk about it. That kind of story spreads faster than any training manual.
Step Three: Measure What Actually Matters
Analytics is not a science project. It exists to produce results. So track the outcomes that prove your work has value.
Look for tangible changes. Did your analysis lead to a process change that saved $50,000? Did a product tweak based on data scraping of user behavior increase engagement by 10%? Did a customer segment analysis boost satisfaction scores by five points?
These are the numbers that keep your analytics initiative funded and respected. A modern data stack built for this purpose makes measurement easier because it connects raw data directly to business metrics through automated pipelines and clean reporting layers.
If you are early in your analytics career and want to build these skills from the ground up, check out our guide on how to succeed as a data analyst in 2026. It covers the exact practices that top performers use to drive impact at their companies.
Remember: strategy is not a one-time thing. Revisit your goals every quarter. Adjust your KPIs. Keep asking what the business needs next. That is how analytics becomes a true driver of growth, not just a source of static reports.
6. Common Pitfalls in Data Analytics and How to Avoid Them
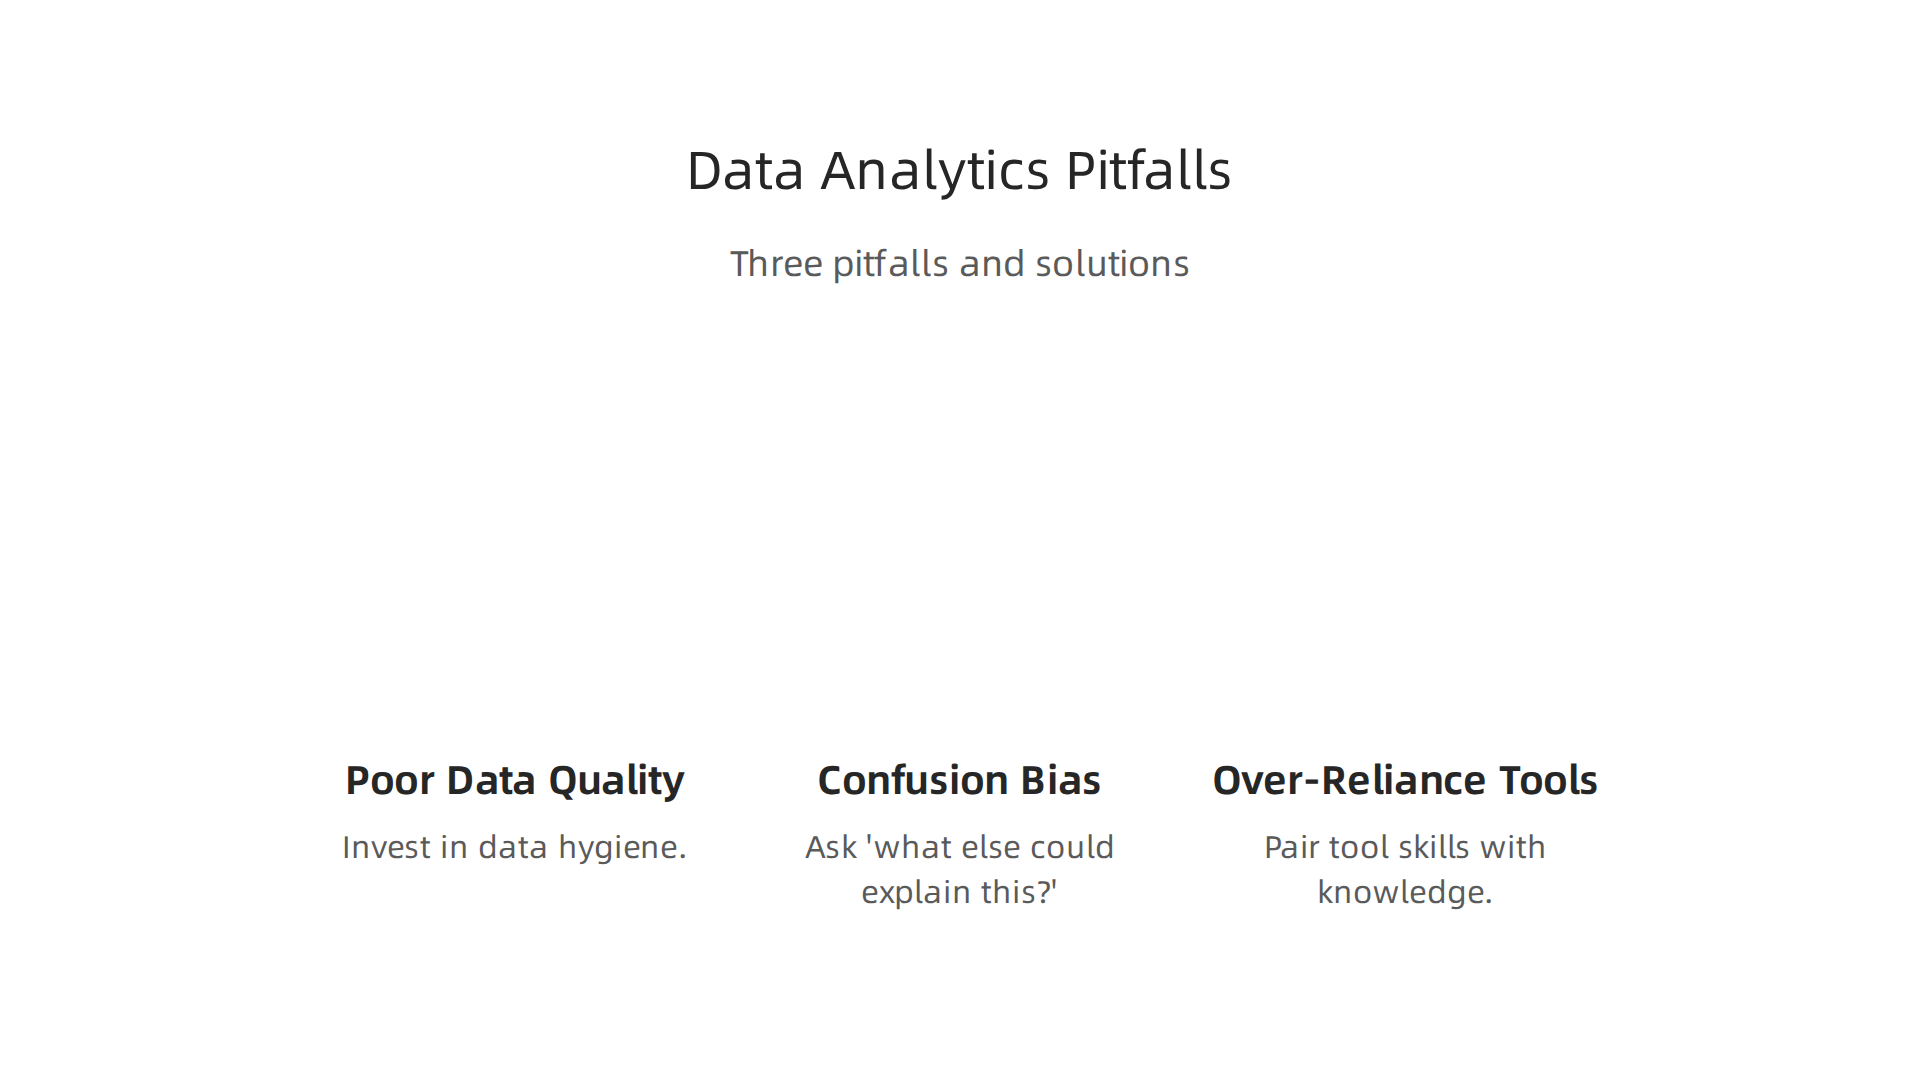
Even with a strong strategy, things can go wrong. Data analytics seems straightforward on paper, but real teams run into the same traps again and again. Here are the three most common pitfalls and how to steer clear of them.
Pitfall 1: Poor Data Quality and Governance
You have probably heard the phrase "garbage in, garbage out." It is the biggest problem in analytics. If your data is messy, incomplete, or inconsistent, no amount of fancy tools will save you.
The solution is to invest in data hygiene from day one. Set clear rules for how data is collected, stored, and cleaned. Build automated checks that flag missing values or duplicates. Document where each data point comes from.
Modern analytics platforms have built-in governance features that help with this. As the 2026 comparison of top data analytics platforms from Matomo points out, the best solutions depend on your organization’s needs, but all of them require clean data to work well.
Do not skip the boring work of data cleaning. It is the foundation of everything else.
Pitfall 2: Confusion Bias and Misinterpreting Correlations
It is easy to see patterns that are not really there. You might notice that ice cream sales and drowning incidents both go up in summer and assume one causes the other. That is confirmation bias at work.
In business analytics, this looks like celebrating a sales spike that actually came from a one-time event, not your new campaign. Or blaming a drop in engagement on a product change when the real cause was a competitor’s launch.
The fix is simple but hard: always ask "what else could explain this?" Run A/B tests when possible. Share your raw findings with a skeptical colleague before drawing conclusions. A second pair of eyes catches false correlations better than any algorithm.
Pitfall 3: Over-Reliance on Tools Without Domain Expertise
Tools like Power BI, Tableau, and Snowflake are powerful. But they cannot replace human judgment. A dashboard can show you a trend, but only someone who knows the business can explain why it matters.
A common mistake is letting the tool drive the analysis instead of the other way around. You end up with beautiful charts that answer the wrong question.
Domain experts know which data points are meaningful and which are noise. If you are an analyst, spend time learning the business side. If you are a business leader, stay involved in the analysis process. The best results come from pairing tool skills with real-world knowledge.
If you want to deepen your understanding of how data and AI work together in 2026, check out our guide on AI data analytics trends that deliver real results. It covers how to combine tools, strategy, and domain expertise effectively.
Keeping up with the latest in analytics and AI takes consistent effort. For daily insights that cut through the noise, consider The AI Newsletter Worth Reading from The Deep View. It delivers clear, actionable updates straight to your inbox so you never miss what matters.
Summary
This article explains what data analytics really is and why it matters for AI professionals and business leaders in 2026. It defines analytics, differentiates it from business intelligence and data science, and breaks down the four core types—descriptive, diagnostic, predictive, and prescriptive—so you know which to apply. The guide maps a practical five-step workflow from data collection to interpretation, highlights the modern tools and AI-native platforms transforming analysis, and shows how to choose technology that fits your use case. It also explains how to build a strategy tied to business goals, create a data-driven culture, and measure impact so analytics produces real value. Finally, it warns about common pitfalls like poor data quality, false correlations, and over-reliance on tools, and points to next-step resources and certifications for analysts. After reading, you’ll know how to plan projects, pick tools, avoid mistakes, and turn raw data into decisions that move the business.